Tornado Risk & Radar Coverage Analysis Dashboard
Project Summary & Skills Used
Team Members
- Gayle Taylor – ePortfolio
- Gennifer Gutierrez – ePortfolio
Project Overview
Our project focused on analyzing historical tornado data and evaluating radar coverage across the United States. The primary goal was to identify where high-impact tornadoes are most likely to occur and determine whether current radar placement effectively supports those areas.
We used tornado data from the National Weather Service and limited the dataset to 1995–2025, since this period reflects the implementation and expansion of modern radar systems. From this, we developed our own dataset to calculate regional risk values and generate predictions for tornado activity from 2026–2030.
Building on these predictions, we evaluated radar coverage by measuring the distance between high-risk regions and existing radar stations. This allowed us to identify coverage gaps and develop a radar need score that incorporates multiple factors, including tornado frequency, predicted risk, seasonal trends, and geographic distance. :contentReferenceoaicite:0
Rather than relying on a single variable, this approach allowed us to prioritize regions where high tornado risk overlaps with limited radar coverage. Our final recommendations focused on regions that consistently appeared high in both risk and coverage gaps, making them strong candidates for improved monitoring.
To better interpret and communicate these results, we developed an interactive map using Vaadin that visualizes both tornado risk and radar need across regions. This allowed us to compare patterns spatially and better understand how coverage aligns with predicted risk. :contentReferenceoaicite:1
This project connects to Industrial Engineering through data modeling, system optimization, and decision-making. Specifically, we applied these concepts to determine more efficient placement of radar systems to improve detection, coverage, and overall public safety.
Skills Used
This project required us to combine programming, data analysis, and visualization to move from raw data to meaningful conclusions.
We built custom Java classes to organize and manage large datasets, which helped structure the data in a way that made analysis more efficient. Using Tablesaw, we filtered, grouped, and summarized tornado data to identify patterns in high-impact events.
We applied machine learning through SMILE (RandomForest) to generate predictions for future tornado activity. This required not only running the model, but also adjusting it when results did not align with expected real-world patterns.
We also worked with CSV files for data input and output, ensuring that our datasets could be updated, reused, and shared across different parts of the project.
To visualize our results, we used Vaadin to build an interactive map that allowed users to explore both tornado risk and radar coverage. This added a user-facing component and helped translate complex data into something more understandable.
Throughout the project, we collaborated using GitHub, which allowed us to manage code changes, track updates, and work as a team without overlapping or losing progress.
Project Development Process
Our original goal was to predict where high-impact tornadoes are most likely to occur and then evaluate whether radar coverage in those areas was sufficient.
We started by filtering historical tornado data and classifying high-impact events (EF3 and above). From there, we calculated regional risk values based on tornado frequency and severity. This formed the foundation for our predictive model.
As we moved into forecasting, we trained a RandomForest model to predict future tornado activity. However, early results revealed issues with unrealistic predictions, particularly in regions and months where tornado activity is historically low. To address this, we adjusted our approach by using median values instead of means and added smoothing based on historical data. This helped produce results that better aligned with real-world patterns.
Once we established reliable risk predictions, we shifted focus to radar coverage. We calculated the distance between each region and existing radar stations, which allowed us to identify areas with potential coverage gaps. From there, we developed a radar need score that combined predicted risk, tornado frequency, distance from radar, and seasonal weighting.
One of the more complex parts of the project was balancing these variables into a single score. We tested different weights and thresholds to ensure the model highlighted regions that were both high-risk and underserved in terms of coverage.
Finally, we brought everything together through an interactive map built in Vaadin. This allowed us to visualize both tornado risk and radar need, making it easier to compare regions and understand how our model translated into real-world recommendations.
Overall, the project evolved from a basic prediction model into a more comprehensive system that connects forecasting with infrastructure decision-making.
Key Features or Highlights
Risk Modeling
We developed a risk modeling system using historical tornado data to estimate the likelihood of high-impact tornado activity by region. Early versions of the model produced inconsistent results, so adjustments were made by shifting from mean-based calculations to median values and incorporating smoothing techniques. These changes reduced the impact of outliers and produced results that better aligned with expected tornado patterns.
Radar Coverage Analysis
To evaluate existing infrastructure, we calculated the distance from each region to the nearest radar station. This allowed us to identify coverage gaps, particularly in rural and high-risk areas where detection may be limited. By incorporating geographic distance into our analysis, we were able to move beyond prediction and assess system effectiveness.
Radar Need Score
We developed a radar need score that combines multiple factors, including predicted tornado risk, tornado frequency, distance from existing radar, and seasonal weighting. Rather than relying on a single variable, this approach allowed us to prioritize regions where high risk overlaps with limited coverage. This scoring system served as the foundation for identifying recommended radar placement locations.
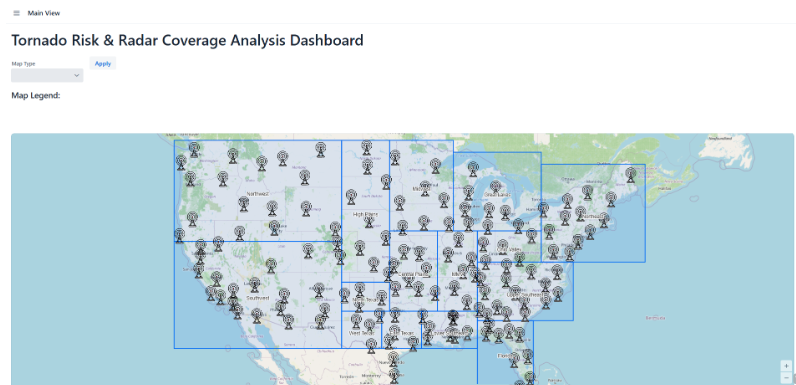
Interactive Map
To communicate our results more effectively, we built an interactive dashboard using Vaadin. The map allows users to switch between views and visually compare tornado risk and radar coverage across regions.
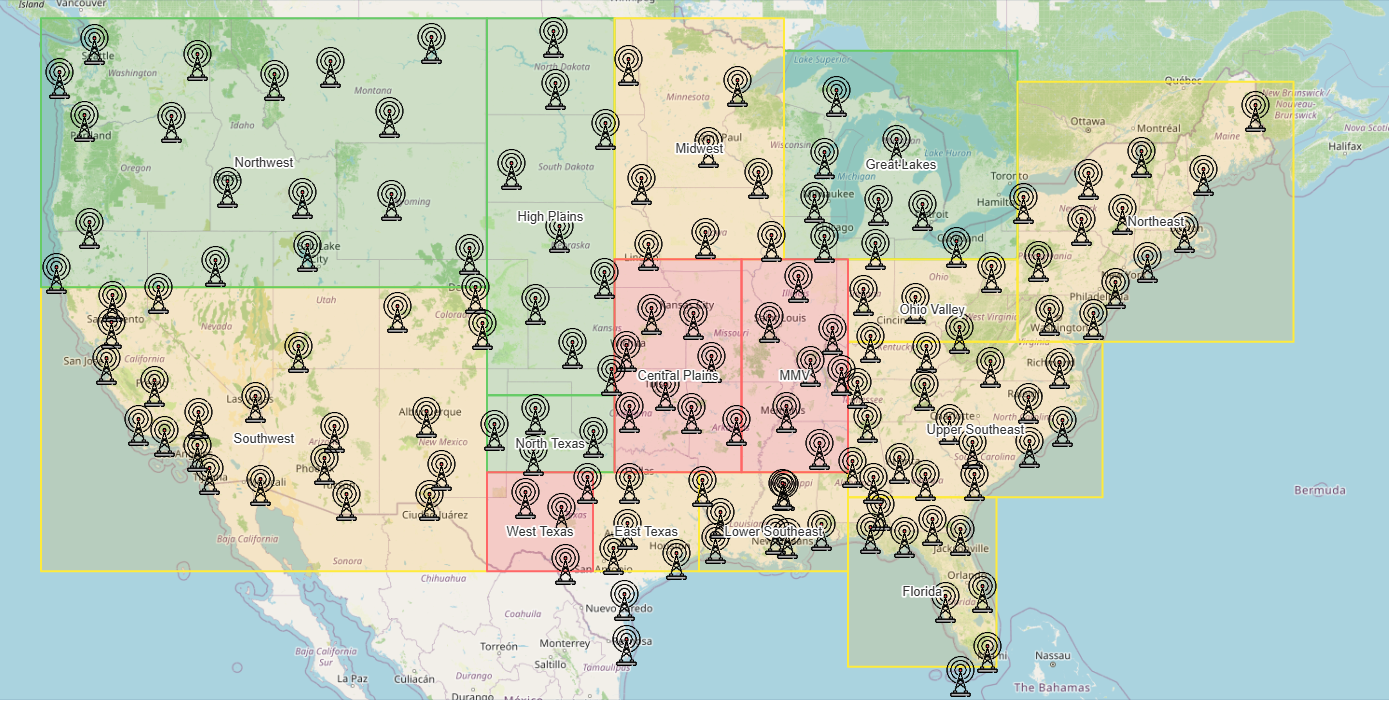
Risk View
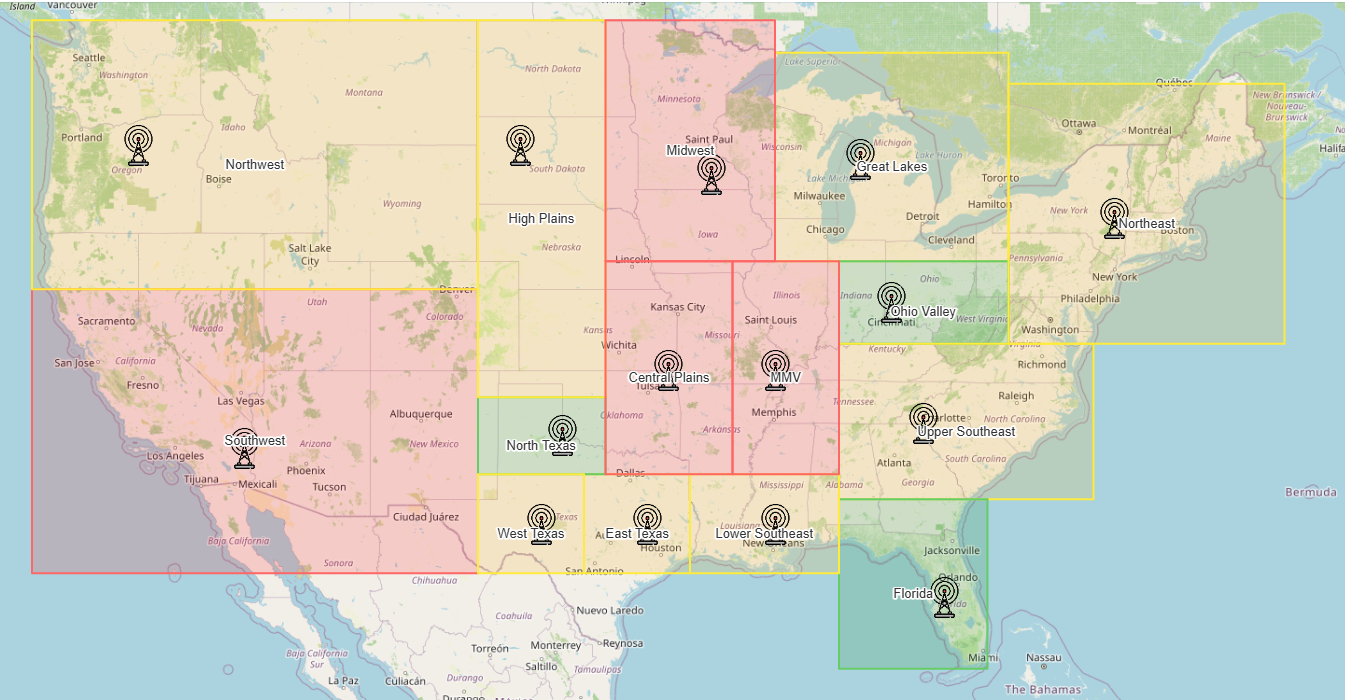
Radar Need View
Optimized Radar Placement
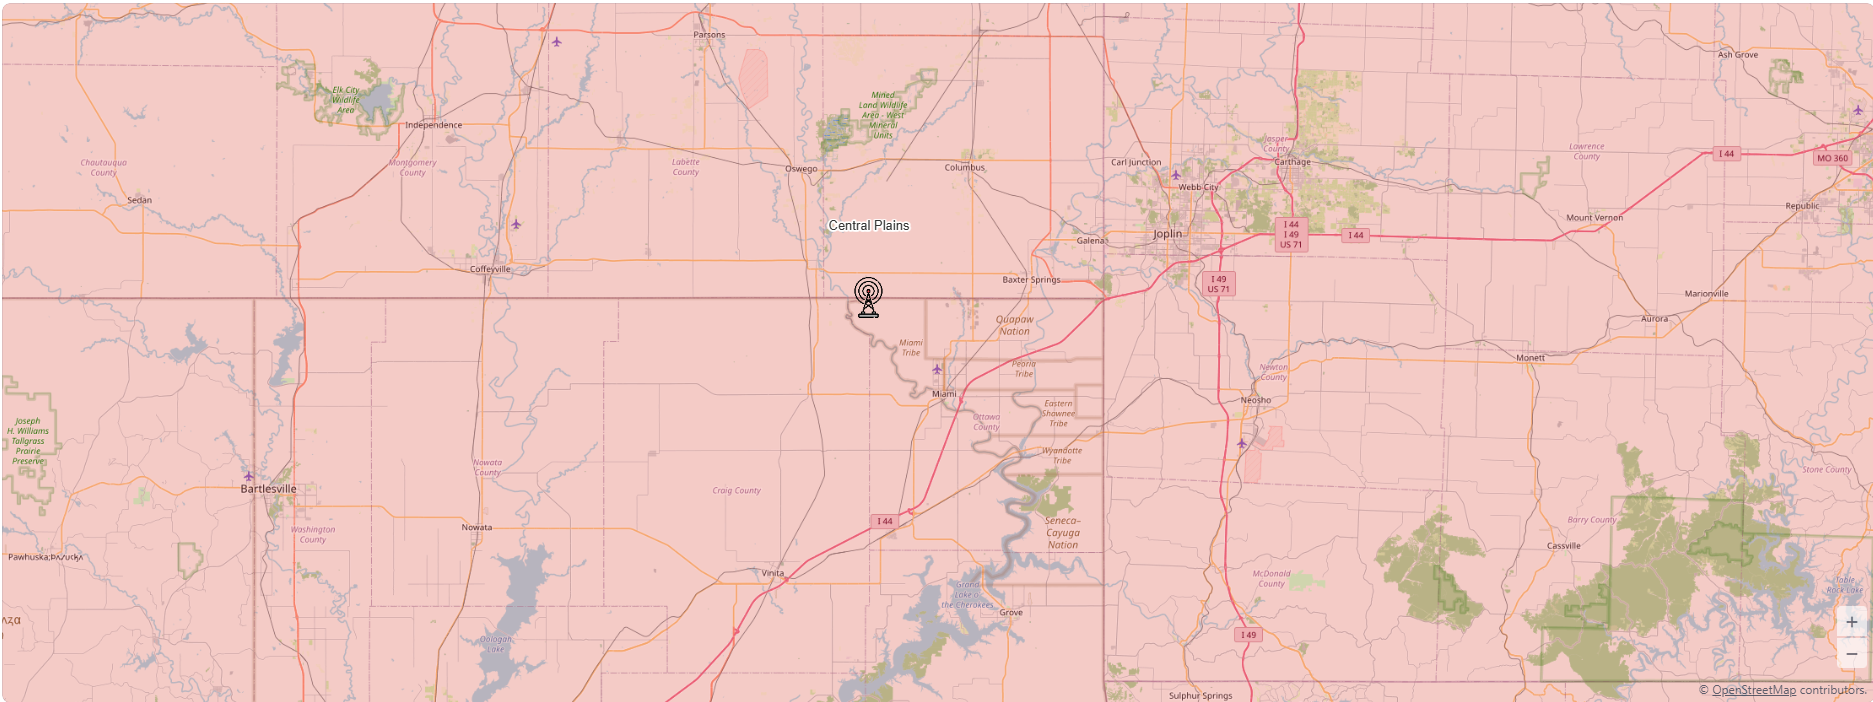
Above is an example from the Central Plains; the zoom feature allows users to more precisely identify the optimized radar location.
Project Documentation
Reflection
This project provided a stronger understanding of how data modeling connects to real-world decision-making. Rather than simply calculating values, the focus shifted toward evaluating whether those results aligned with realistic tornado patterns and radar coverage limitations. This required both technical implementation and interpretation of the model outputs within the context of the problem.
At the same time, the development process introduced several challenges. Early versions of the risk model produced unrealistic predictions, which required adjustments to both the calculation method and the way the data was summarized. Shifting from mean-based calculations to median values, along with incorporating smoothing techniques, helped reduce the influence of outliers and improve the overall reliability of the model.
In addition, this project strengthened problem-solving and debugging skills. Several components, including the radar need score and mapping features, required multiple revisions before functioning as intended. Working through these challenges reinforced the importance of testing, iteration, and flexibility when developing data-driven systems.
Overall, this project increased confidence in working with data, building predictive models, and applying those results to practical scenarios. It also demonstrated how technical tools can be used to support more informed and effective decision-making.